Wednesday, 29 March 2023

Car Parks in Belper

 There seems to be a lot of opinion being aired on social media regarding the issue of so-called "free parking" in Belper. It is important in such matters to distinguish facts from non-researched belief and this post attempts to provide that factual base. The main contentions are that businesses will be harmed and that poor people will be impacted adversely but first let's look at why charges are being introduced.

Coppice car park charges.

Referring to the Belper Town Council website provides us with a succinct account of their reason for introducing charges: https://www.belpertowncouncil.gov.uk/news/2023/03/coppice-car-park. We see that the cost in business rates is £22,500 per year (and I know that when these rates were applied by central government the charges were backdated to 2017. So not only does BTC have to pay the current years charge but make good the backdated amount which more than doubles the amount for, I think, three years (though business rates were suspended for one year during the Covid pandemic). The council states, "As a council, we believe it is fairer that users of the car park pay for their usage rather than this cost being supported by everyone in the town regardless of car ownership."

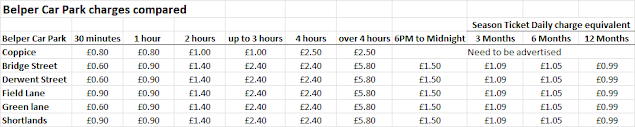
The suggested charges are shown below compared to other car park charges in the town:

You can find the AVBC car park information at: https://www.ambervalley.gov.uk/roads-and-parking/parking/

It should be noted that there is still more consultation required before charges are fixed and conditions applied. I can see that a change to the 4 hour charge on the Coppice may be anticipated because it stands out as the only increase over a charge in the other car parks. There has to be some clarity on the "over 4 hours" charge at the Coppice - does this mean 24 hours? If it does then that is superb value for those who park there and walk down to catch a train. Compare £2.50 with the charge of £14.50 at Derby Railway Station.

There will have to be some thought about season tickets and how they line up with AVBC offer but 99p a day that is hard to beat.

Finally, nearby residents will be offered parking permits as they currently depend upon the Coppice for longer term parking. This is a good step but which streets are referred to as "nearby" needs to be determined.


Will businesses and shops be harmed? 

There is a lot of misinformation being put online at the moment, some claims seeming incredible. I read that 97% of Belper residents were opposed to Coppice car park charges and that 86% of businesses were against it. I don't know anyone who has taken part in such a survey. When offered claims like this the Office for National Statistics advise that all evidence of such a survey should be disclosed. For example, 100% of the people I live with claimed that they were my wife. I think you get the picture.

As to businesses being polled; Belper Town Council invited local shops and businesses to take part in the initial round of consultation and only 2 responded. I can well understand that most shops are not too concerned as the sum total of car park spaces is well over a thousand (600 between AVBC & BTC plus all the supermarket car parks). The figure is probably much more as I have no hardened data for the spaces at Morrisons, Aldi and the Co-op. I estimate that the Coppice car park constitutes about a sixth of the total number of spaces available. If we factor in the AVBC residents permit and the number of folk who access the town via public transport or on foot/bicycle then the percentage impact of Coppice  car park charges on business is negligible. You have to keep a sense of proportion.

There are academic studies that look at the effect of withdrawing so-called free parking from town centres and I link to them here:

Leeds University - Parking Charges

Institute for Transport Studies

OECD - The Environmental effects of parking

These  three studies clearly show that charging for parking does not harm business activity and can offer clear commercial, environmental and health benefits. Below is one of a number of summary panels which are included in the Leeds University study (apologies for the quality of the image - I used screen snip)


Which brings us to:

Impoverished motorists

Sadly, the number of impoverished motorists has grown over the last few years as incomes have not kept up with the rising cost of living, exacerbated by a steep rise in inflation over the past few months. Let's look in more depth.

Pensioners in general have the time to shop and park using their AVBC residents permits and for a modest sum can do so after 14:00. They also have the use of a Gold Card and can travel on buses free after 09:30.

Household deprivation - Referring to the data now available from the 2021 Census we get a range of data to help us assess the number of motorists who may be impacted by proposed Coppice car park charges. For a start, 15% of households do not own a vehicle. Looking at the socio-economic data indicates, (if we assume levels 13 and below could be counted as impoverished) that there is a potential for 22% of people between the age of 16 and 64 could be impoverished. This does include 4.5% classified as students. I know that income data included in NP4B (Neighbourhood Plan for Belper) showed a potential for 14% of households to be below the poverty threshold (below 60% of current median (or typical) household income, taking into account the number of people living in the household. This does of course include all ages.

So how many motorists are impoverished? Sadly, many are but how many impoverished motorists use the Coppice car park ......... that we don't know. There are alternatives as I hope this article has shown however, some form of initiative to assist those dependent on cheap parking to gain an annual season ticket would be beneficial to ......... how many we don't know.


Source: https://www.ons.gov.uk/visualisations/customprofiles/build/

In conclusion

There are so many facts left out of this post. So much data from the 2021 Census or the Department of Works and Pensions area income data ................ or the Department for Transport annual traffic flow surveys  and for this you could look at  the NP4B on the Belper Town Council Website, specifically Addendum 5 Traffic survey and parking or Addendum 6 - Public Transport which does include data from the 2011 census showing that 33% of the 10th or lowest socio-economic households have the use of a single car.

You see, this is the sort of evidenced information that is needed if a true understanding is to be made of issues such as this. We live in the twenty first century and there should be no place for biased and deliberately misleading information to be spread on social media. 

Wednesday, 31 August 2022

EMR announce the resumption of peak hour through services, Matlock - Nottingham - Matlock from Monday 12th December 2022

 EMR have announced that peak hour through services, Matlock - Nottingham - Matlock will resume from Monday 12th December 2022. This announcement has been made by Will Rogers, Managing Director of East Midlands Railway.

He states:

"Services will operate in both directions during the morning and evening peaks, Monday to Friday – calling at all stations. As a result, we will also be reinstating hourly peak time services at Spondon and Attenborough. These services have been chosen as we believe they will provide the biggest benefit to customers while also being mindful of our levels of resource and the performance impact – particularly around Nottingham. Online journey planners are in the process of being updated and timetables will follow soon. In the meantime, I have included an outline timetable below. There may still be minor amends to the times below as a result of further validation so please continue to check before travelling.

Nottingham – Matlock 

Depart: 0653 Arrive: 0807 

Depart: 0753 Arrive: 0908 

Depart: 0854 Arrive: 1007 

Depart: 1554 Arrive: 1706 

Depart: 1654 Arrive: 1806 

Depart: 1754 Arrive: 1856 

Matlock - Nottingham 

Depart: 0617 Arrive: 0722 

Depart: 0712 Arrive: 0815 

Depart: 0813 Arrive: 0922 

Depart: 1515 Arrive: 1618 

Depart: 1615 Arrive: 1723

Our aspiration remains to introduce direct services between Matlock and Nottingham throughout the day and on Saturdays as well as further services on other parts of the EMR Regional network. However, that remains subject to the allocation of the necessary funding, maintaining levels of performance (punctuality) and the delivery of additional rolling stock. We will continue to provide updates as these workstreams progress in the months to come. I hope you will welcome this step forward and we look forward to the services resuming in December. 

 Kind regards, Will Rogers Managing Director East Midlands Railway"

Well done EMR for listening to passengers, particularly those who depend upon the service to get to work and college. We were promised a positive response at the meeting arranged by the Mayor of Belper with EMR management in March at the Strutt Centre. Special thanks to Laura Etheridge whose help made that meeting possible. We wanted a full restoration of service but all present accepted that peak hour trains should be a priority. 

Monday, 13 December 2021

Derbyshire Tories public transport plans - Less for More

 The woeful performance of Debyshire County Council (DCC) Tories in dealing with the cancelation of the 71 & 72 bus routes after Christmas has prompted a re-emergence of BelperStuff blog. This is yet another example of Tories claiming big investment into transport needs when the reality is cut after cut. The best way to illustrate this is to follow a timeline through the years of austerity. Yes this is the root cause of cuts to services, the year by year shrinking of the grant from central government to local authorities. The Tories took control in Westminster in 2010, at a time when the economy was starting to recover from the global credit crunch, with the promise that the country would have a balanced budget by May 2015. In the 2019 election the latest Tory prediction was that a balanced budget would be acheived by 2023 .... or would that be 2025.

2011 - More for Less ................. or .............. Less for More

Derbyshire County Council dutifully followed the party line and adopted policies reflecting the philosophy of austerity. This meant cuts to Derbyshire services but strategy papers tried to put a positive spin by claiming that efficiencies would be found to enable a bright shiny future under the Tories.

Derbyshire Local Transport Plan 2011 - 2026 


This plan was full of definitions of how decisions and policies would be determined but very short on key investment objectives. Mostly concerned with roads and potholes the only tangible policy initiative for public transport would be "Public transport (bus and rail) information"; found on page 4 of the document with nothing else of note in the following 121 pages. So the Tory promise for public transport over 15 years would be to improve information.

2017 - Tory County Council Election manifesto promise

"We will reverse Labour's cuts and restore important access to health and social care, shopping and social activities". 

Six years later and the cuts to services following the Tory Westminster government inspired austerity measures and the starvation of funds available to local authorities, meant that bus services would gradually lose county council support funding. The county had become Labour controlled in 2013 and in the run up to the 2017 election provided an analysis of the effect government funding cuts would have on Derbyshire services. The Tory manifesto response to this was to blame Labour for the cuts.

2018 - Derbyshire Tory cuts to bus services

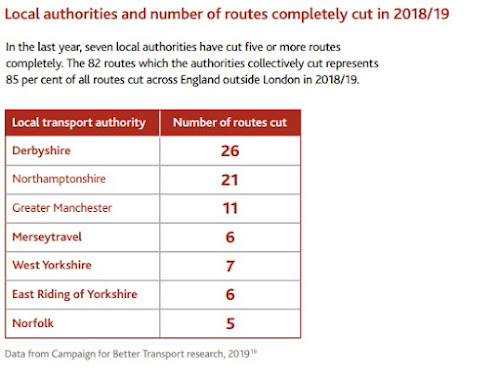
The Tories won back control of DCC in 2017 and by 2018 were making savage cuts to bus services. This is evidenced inThe future of the bus report , a paper produced by the Campaign for Better Transport in 2019. Below is an extract from that report:

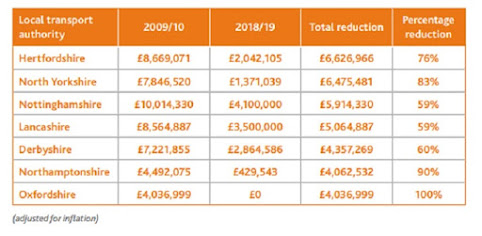
The report clearly shows during 2018/19  Derbyshire Tories were complicit in cutting 26 bus routes; that's 27% of all routes in England outside London. Further to this the report indictes a reduction of 38% in the budget for Derbyshire School transport and that the overall budget for bus subsidy was cut by 60%.


2021 - Derbyshire Tory Manifesto

The only mention concerning buses in the Tory 2021 manifesto is that there would be free companion bus passes for disabled public transport pass holders. No mention of reversal of Tory cuts. The promise of 2017 just did not happen and in the 2021 election the failure to honour that pledge was conveniently forgotten.
-----------------------------------------

So now we turn to what was said by the Leader of DCC following the electoral victory in 2021. delivery-pace-will-be-our-mantra-council-leader-cllr-barry-lewis-sets-out-aspirational-vision and here are listed key passages from the DCC AGM speech: 

"I am immensely proud of the achievements of the last four years

We know too that there is going to be significant change and hopefully investment coming for public transport, because something transformative needs to happen in this space to ensure we can meet our carbon reduction targets, not just locally but nationally.  As an administration we’ve already committed to working with the Peak District National Park Authority to trial and deliver innovative public transport solutions there. 

 our innovative Levelling up for Young People scheme, something I’m particularly keen on.  It is sadly the case that too many young people in Derbyshire, mainly young white males in our instance but also young white females to a lesser extent find themselves disconnected from education, educational opportunities and therefore from the world of work and possibly ending up getting involved in illegal or criminal behaviours eventually.

We’re also keen to get on with delivering our commitment for Companion Bus Passes for disabled public transport users, an important scheme that will make a big impact on the lives of some disabled people in Derbyshire.  It’s not just about the big things but about looking at where we can make a real difference to the lives of Derbyshire residents".

I will finish by saying we have a new mantra for the next four years “Delivery at Pace”  

-------------------------------

Welcome to the paralell universe inhabited by the entitled Derbyshire Tories. Barry Lewis is proud of being the leader of the county that cut more bus services than anywhere else in England. At least there is an acknowledgement that there has to be investment in public transport but 7 months later, when the resolve of Barry is tested by the unsustainability of the 71 & 72 bus routes, Derbyshire Tories can find no investment; their only concern being carbon reduction targets. Is this a hint of how that will be acheived .............. less buses equals less carbon in the atmosphere? Do they not realise that with every bus that is cut from service there will be an increase in the number of cars travelling on our roads?

Barry - if you are serious about carbon reduction then put your money into public transport.
(sorry, that should be our money raised from taxes)

Barry then goes on to comment on the "Levelling Up for Young People Scheme" which will address the disconnect with "education, educational opportunities and therefore with the world of work." The first priority for young people to access anything is to be able to get to where those opportunities exist. Cutting bus routes stops this sort of initiative dead in it's tracks. 

Barry does however point out that these nebulous Tory ambitions will be subject to "Delivery at Pace". What good is that catchphrase for those who become isolated and disenfranchised from normal opportunities of life, because their bus services have been cut. If they have no car then the alternative is to go by foot; for them it will be:

Delivery at Walking Pace

Sunday, 12 December 2021

Bus services lost in Belper - We expect better from our county council

The recent announcement by Notts & Derby Bus company that they could not make the 71 and 72 routes between Belper and Derby pay or even recruit enough drivers came as a real shock for residents who depend upon these services to get to work, college or school; to shop or have an acceptable level of cultural or social life. Derby Telegraph December 1st article

Many in the community contacted Derbyshire County Council to urge them to step in and this they have done though the solution that has been agreed for the continuance of service past the threatened deadline of Christmas Eve is far from ideal. Ther Derby Telegraph reported the 7's being replaced from 29th December by an extension of the 137/8 Langley Mill <> Belper service which would allow passengers to access Derby via a connection with the 59/59A Derby <> Shipley service but in reality the best routing will be via  "the nines" at Kilburn Toll Bar. BelperStuff checked the Derbyshire County Council website news to check for accuracy but here too it states that a combination of 137/8 and 59/59A services will replace the 71/72 services when they are discontinued we must hope that more definitive information will emerge in the next few days.

Timetables/ 137& 138 Belper<>Langley

Timetables/ 59/59A

Timetables/ the nines Derby <> Ripley etc.

Aside from passengers from Holbrook, Bargate and Parks areas losing their direct link with Derby this effectively means that on a school day the first bus into Belper from the Parks will be at 09:49. The loss of the 72 service impacts badly on not just the Parks Estate etc but also Mount Pleasant.

There are still questions to be answered:

  • Where are passengers expected to change between the 138 and the 59 services?
  • When will an integrated timetable be available?
  • Will through ticketing be allowed if passengers combine the 138 and the more obvious 9 services?

Belper estates still lack services in the evenings or on a Sunday.

This is hopefully an interim situation

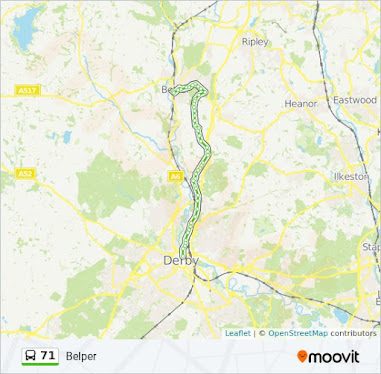
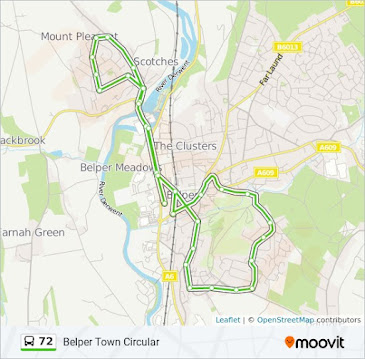
The routes being lost are:


 Credit to moovitapp for these maps

The loss of the 71 and 72 services has happened despite promises by Derbyshire Tories to protect public transport in the county. In 2011 they proudly announced "more for less" in their Derbyshire Local Transport Plan 2011 - 2026. Cancelation of bus routes is what they are actually delivering. BelperStuff will explore the Tory record on public transport in Derbyshire in the next blog post - Less for More.


Thursday, 6 May 2021

Impacts of Neighbourhood Planning in England - a report by Reading University - 2020

BelperStuff has been re-activated because of the odd comments that are being posted on Belper social media that are trying to trash the Neighbourhood Plan for Belper (NP4B) which is subject to a referendum being held on May 6th 2021. Sadly this report has only just come to the attention of this blog but I post here, at the eleventh hour in an attempt to dispel opinions that are, in effect, just that .. opinions. What follows is evidence that has been gained by an extensive desk study analysis of 141 plans as well as a cohort assessment of 865 completed neighbourhood plans; 143 questionnaires targeted at active neighbourhoods and Local Planning Authorities. Nine case study areas across England involving 20 neighbourhood plans were studied and three targeted discussions with developers, non-completing groups and active neighbourhood planning consultants

This is a report commissioned by the Ministry of Housing, Communities and Local Government which has been undertaken by the University of Reading. The link to the document is below: 

https://assets.publishing.service.gov.uk/government/uploads/system/uploads/attachment_data/file/929422/Impacts_of_Neighbourhood_Planning_in_England.pdf


To best describe the scope of the task set the University here is an extract from the report:

1.2 Research Brief 

The research was set out by MHCLG to cover a series of core Research Objectives (ROs). These concerned: 

  • Development Impacts and Housing Supply 
  • Other Development Impacts (including Quality of Development) 
  • Decision-Making and Investment 
  • Community Attitudes and Engagement 
  • Influence of Geography 
  • Success Factors and Common Barriers
The key findings are to be found in the Executive Summary which is extracted below:

The key findings are set out in precis and organised here by the six Research Objectives: 

1. Development Impacts and Housing Supply Neighbourhood planning’s contribution to housing supply can be significant. Neighbourhood plans which are allocating housing sites are providing sites for an average additional to local plan allocation 39 units per neighbourhood plan. The study found 18,000 units above LP allocations in 135 plans. However communities seeking to make housing allocations did encounter added burdens, both technical and political compared to creating a non-allocating NP. Scaling-up production of NPs could make a significant contribution to housing supply – particularly if cooperation between neighbourhoods and LPAs are strengthened further. There was no evidence found that NPs displace development from other parts of the local authority area. 

2. Other Development Impacts (including Quality of Development) Neighbourhood plans have helped improve design policy and refined local priorities e.g. housing for specific societal groups. There is further potential within the neighbourhood planning process to reflect both community needs and tie with more strategic concerns coming from above. Closer partnership working between communities and planning professionals (i.e. local government planners and planning consultants) can help address this. Better recognition and more targeted support for the effective integration of placemaking matters that go beyond pure land use planning policy would also benefit neighbourhoods and other interested parties (e.g. local government, third sector, funders). 

3. Decision-Making and Investment Neighbourhood plans have improved local engagement with local planning authorities, and are important vehicles for place-making beyond land use planning. Other initiatives have included the establishment of Community Interest Companies and Community Land Trusts. Impacts of Neighbourhood Planning Page 4 of 44 This highlights that communities lack a formal arena for place-making projects unrelated to planning policy, and may help explain why a large number of communities have not completed land use plans (NDPs). In terms of how the Plans are used in practice, the evidence from LPAs and appeals indicates NPs do have an influential role in decisions, reflecting their legal status, and as a minimum they provide nuance to decisions. Over half of LPA respondents see NDPs as having a ‘moderate’ or ‘high’ degree of influence on decision-making. Moreover, responses suggest the vast majority of decisions that go to appeal go in favour of the relevant NDP. However, their impact will vary according to the circumstances and Plan policies. We found no evidence that NPs were ignored but some communities felt Plans were not always recognised as clearly as they would wish. This indicates that LPAs could better communicate how neighbourhood plans have been taken into account and highlights the value of clear and specific policies that have been road-tested by development management officers. MHCLG could share best practice to support LPAs in their role in developing and implementing NDP policies. 

4. Community Attitudes and Engagement Community attitudes to development may become more positive as a result of the NP experience, and the acceptability of development is supported by a large proportion of Plans with policies on design and affordable housing. Some neighbourhoods reported better relations with LPAs and a more positive attitude to development, but in other cases poor relations with some LPAs and lack of an up-to-date Local Plan also presented a barrier. There was no clear evidence that there is faster delivery of sites, though where sites are chosen in the NDP they are clearly more accepted by the community, which can reduce delays associated with legal challenges or other forms of opposition. Often allocation of sites is a motivator as it allows greater protection of other locally important spaces. It is therefore important to maintain protection for neighbourhood plans from speculative development. 

5. Influence of Geography While there has been strong take-up of neighbourhood planning since 2011, there are many neighbourhoods who have not used this community right. The total number of communities who have started or completed neighbourhood planning went beyond 2,600 in Autumn 2019, but the take-up rates have slowed considerably. The main reasons for this are associated to known time, processual and technical burdens, relationship with local plan progress, and levels of enthusiasm in some local planning authorities. This indicates that for some neighbourhoods an uptodate Local Plan lessens their concern to finalise a NDP. There is a noticeably low take-up in urban areas, and in northern regions. It is notable that all LPAs with no activity are urban. There are a range of reasons for this disparity and if government wish to continue to support the initiative there will need to be affirmative action taken to sustain and expand neighbourhood planning activity. Government are missing an opportunity to realise benefits in urban and deprived areas and assist in their levelling-up agenda. As such Government should consider either increasing support to reflect additional Impacts of Neighbourhood Planning Page 5 of 44 challenges faced by these communities, or ensure community engagement/involvement, in other less burdensome ways. 

6. Success Factors and Common Barriers While NP is a manageable process for most parished communities and a NDP is an achievable goal, support from consultants and positive relationships with LPA are important to helping with progress. MHCLG could do more to identify and share best practice for LPAs, particularly around site identification. The process remains burdensome for community volunteers with the time taken to reach completion around three years (and for many it can take longer). NDPs take longer when Local Plans are in progress, particularly where a new Local Plan is initiated after NDP work has started. This can add a further 6-10 months to NDP production on average. Better alignment with LPAs and Local Plans may assist here. Local Planning Authority (LPA) support overall is varied, with examples of strong support but also ambivalence in other areas. A common criticism was duplication of policies and MHCLG could find ways of better aligning / integrating Local Plans and NP processes – through clearer ongoing communications between LPAs and neighbourhood planning groups.

The full report gives a much better understanding of the important part that Neighbourhood Plans can play in reflecting the wishes of the local community and translating them into an effective planning document.

Friday, 18 October 2019

Shame

30 years after the fall of the Berlin Wall are we now about to witness the creation of the Belfast Wall?


The men who build walls of xenophobia

Thursday, 7 March 2019

Myth spinning - - - Amber Valley Borough Council and the Green Belt

Far Laund - Tories want to build 345 houses here when there is no reason why this is needed

It is a myth that we have to build on Amber Valley Green Belt land. There is a raft of facts and figures that clearly show that we have no need to extend our urban sprawl but listening to a Belper Tory councillor explain why we had to build 345 houses on Far Laund plus nigh on a further 1,700 on other sites in the borough had me shaking my head in disbelief at last Monday's Amber Valley Council meeting.


 This was his reasoning:

  1. The AVBC planning board cannot do it's job properly when dealing with requests to build on unsuitable green belt sites .......... they need a local plan.
  2. The Local Plan is endlessly delayed because the council cannot demonstrate a supply of 5,000 new houses in the next 5 years.
  3. The only way to reach that 5 year target is to allow developers to build on unsuitable green belt sites.
  4. Once developers are allowed to build on green belt land the government inspector will at last accept the AVBC Local Plan so the planning board will be able to do it's job more effectively and resist applications to build on the green belt.

I kid you not. I sat in the Ripley council chamber listening to that drivel. Of course the planning board would find the going easier because it had already given away the prime sites they had been elected to protect. My thoughts turned to the word, "myth" . The decision to build on the green belt based upon evidence that is little more than a myth will ensure that we are heading for years of conflict between residents, AVBC and developers.

All four Belper Tory councillors voted to build on green belt land despite years claiming that a vote for them would be a vote to protect Belper from unwanted development. I am sure that Amber Valley residents will not allow this decision o stand after the borough elections in May. The Labour Manifesto clearly states no building on the green belt so, if they take control we should expect immediate action. 


The Labour opposition pleaded with the  council leader, Kevin Buttery, to separate the extension of  green belt protection over Pottery Farm and Cherry Tree Farm (effectively Bullsmoor) so that the plan to build on other sites could be voted upon solely on its merits. Buttery's refusal was playing politics as it was evident, as the leader of the opposition, Chris Emmas-Williams said, every councillor in this chamber would like to see Bullsmoor suitably protected. All to no avail.

Link to a video of the Council meeting 4th March 2019

I had my name down to speak at the meeting but was told on arrival that I was in fact a reserve speaker as Alan Cox had been chosen to speak about Far Laund. I never had the chance to put the case that there was in fact no need to build on the green belt as there was publicly available data demonstrating something quite different. I was not allowed to speak at the meeting so I'm writing this article now in the hope that this appeasement policy can be stopped.

The facts Amber Valley Tories are not telling you


There were so many red herrings and misconceptions coming from the Tories at that meeting and I had to sit silent. It was galling. Their biggest claim was that we cannot meet the 5 year housing supply target for the 2011 - 2028 period, let's look at that:

  • 2011 = 52,596 homes (from 2011 census)
  • 2018 = 58,000 homes  (AVBC declared domestic council tax payers)
  • Therefore the number of new homes 2011 - 2018 is 5,404
  • In 2018 we reached the 2025 target number of homes 7 years early (according to forecast by GL Hearn consultants for the Derby HMA).
What of going forward:

  • The agreed minimum 9,770 homes by 2028 assumed a target of 62,366 total homes in the borough.
  • Taking the figures included in the last Local Plan draft 2017/2018, AVBC were targeting a total 64,515 homes by 2028.
  • Add in windfall and the effect of releasing green belt land and AVBC are targeting up to 66,000 by 2028. 
  • Simple maths shows that AV Tories are pushing for at least an extra 3,634 above the figure negotiated in the Derby HMA agreement.

Demographic data shows that an increase in AV homes of up to 20% between 2011 - 2028 was inevitable so negotiating a figure of a fraction over 18% was a shrewd move in 2014 (Derby HMA heads of agreement 2014). In the light of the fact that the present Tory council are heading for an increase in AV homes of 25% it does seem strange that their leader, Kevin Buttery, endlessly blames Labour for that 18% increase. If they just made decisions based upon that agreement then we would not be faced with the endless challenges that are to come. Think of the time, effort and money expended in relation to the Belper Lane development, Bessalone and Bullsmoor (to be Belper specific). It has been very costly for protesters, councils and developers. None of it necessary if our communities had been able to rely on AVBC to do what they are elected to do.  

There was no need to add Green Belt sites to the Local Plan as we are already on target and, it should be argued, have already reached our 5 year target. It seems that there is the real world as reflected in council tax returns and the parallel reality of AV Tories who have demonstrated their intent of delivering green belt and green field land to developers when there is absolutely no need to do it. Brownfield sites are deliverable but are not the preferred route of AV Tories. You don't have to rely solely on my analysis ...... the government agrees with me:


This is the ongoing monitoring of new homes being built in England and is presented in spreadsheet form. Amber Valley is the 3rd listed authority showing that in the 3 years between 2015 and 2018 there was a requirement to build 1,136 homes but actual performance was 1,648. They forecast that AV is on course to exceed the required 2028 build by 45%. This is in line with my own calculations. Council officers should be aware of this and therefore so must the relevant AVBC cabinet members.

Now you don't just have my conclusion but also a report from the Department of Housing and Local Government  (DHLG) clearly stating that the borough does not have a problem delivering the 5 year requirement and is in fact deeply in credit. The DHLG are forecasting that Amber Valley will build 14,166 new homes between 2011 and 2028 (remember the target was 9,770) which indicates a total number of homes of 66,762 ........ so if anything I have underestimated.

So what should be done

There is of course the ballot box on May 2nd but following that, on May 3rd the new council must move to negate last Monday's decision to build on the green belt. They should also be reaching for the phone to contact the consultants who carried out the Green Belt report and ask them to carry out a similar exercise but this time for brownfield sites of which there are many in Amber Valley.

We need an Amber Valley Brownfield site  report to finally nail the idea being put forward by the current council that such sites do not deliver the housing needed in the borough. Their argument is wrong ........... for example:
  • The brownfield Belper police station site was developed with 14 homes.
  • Taking that "urban" density and applying it across the 149.5 hectares on the AVBC Brownfield register would net over 7,000 homes.
  • Obviously not all brownfield sites would be that promising but we could expect a minimum of 75% deliverability, say 5,250.
  • Add this to the 5,404 already delivered and we have a total of 10,654 (easily exceeding the target of 9,770)

We must ensure that decisions are made upon facts and not myths